Monday, June 15, 2015

Slope Triangles

    Here is another post that has been in my drafts since March. Oh my! Thank goodness I have summer to sit down and share these with you. Enjoy:)   
    This was the first time I have taught slope triangles. Actually, and don't judge me, I've never given them any time in my curriculum. That changed this year as I decided to spend several days working with them in my Pre-Algebra 8th grade classes. 
     We started our unit with Fawn Nguyen's awesome lesson using staircases to begin our discussion of slope. I know that Fawn used this with her 6th graders but it was appropriate to use with my Pre-Algebra classes. Here is the link to Fawn's first of two posts on this activity. Fawn goes into great detail explaining the questioning and student interaction. Take time to read her posts, they are awesome. Thanks Fawn!  My students completed the worksheet in one class period. I'm hoping that next year we will spend more time with our discussions.
     I love the video that Fawn shared from the Utah Avalanche Center discussing the slope of hills and avalanches. We showed this at the beginning of class the next day.


      Next we did an interactive notebook page on counting to find slope. 
We drew slope triangles and labeled them. 


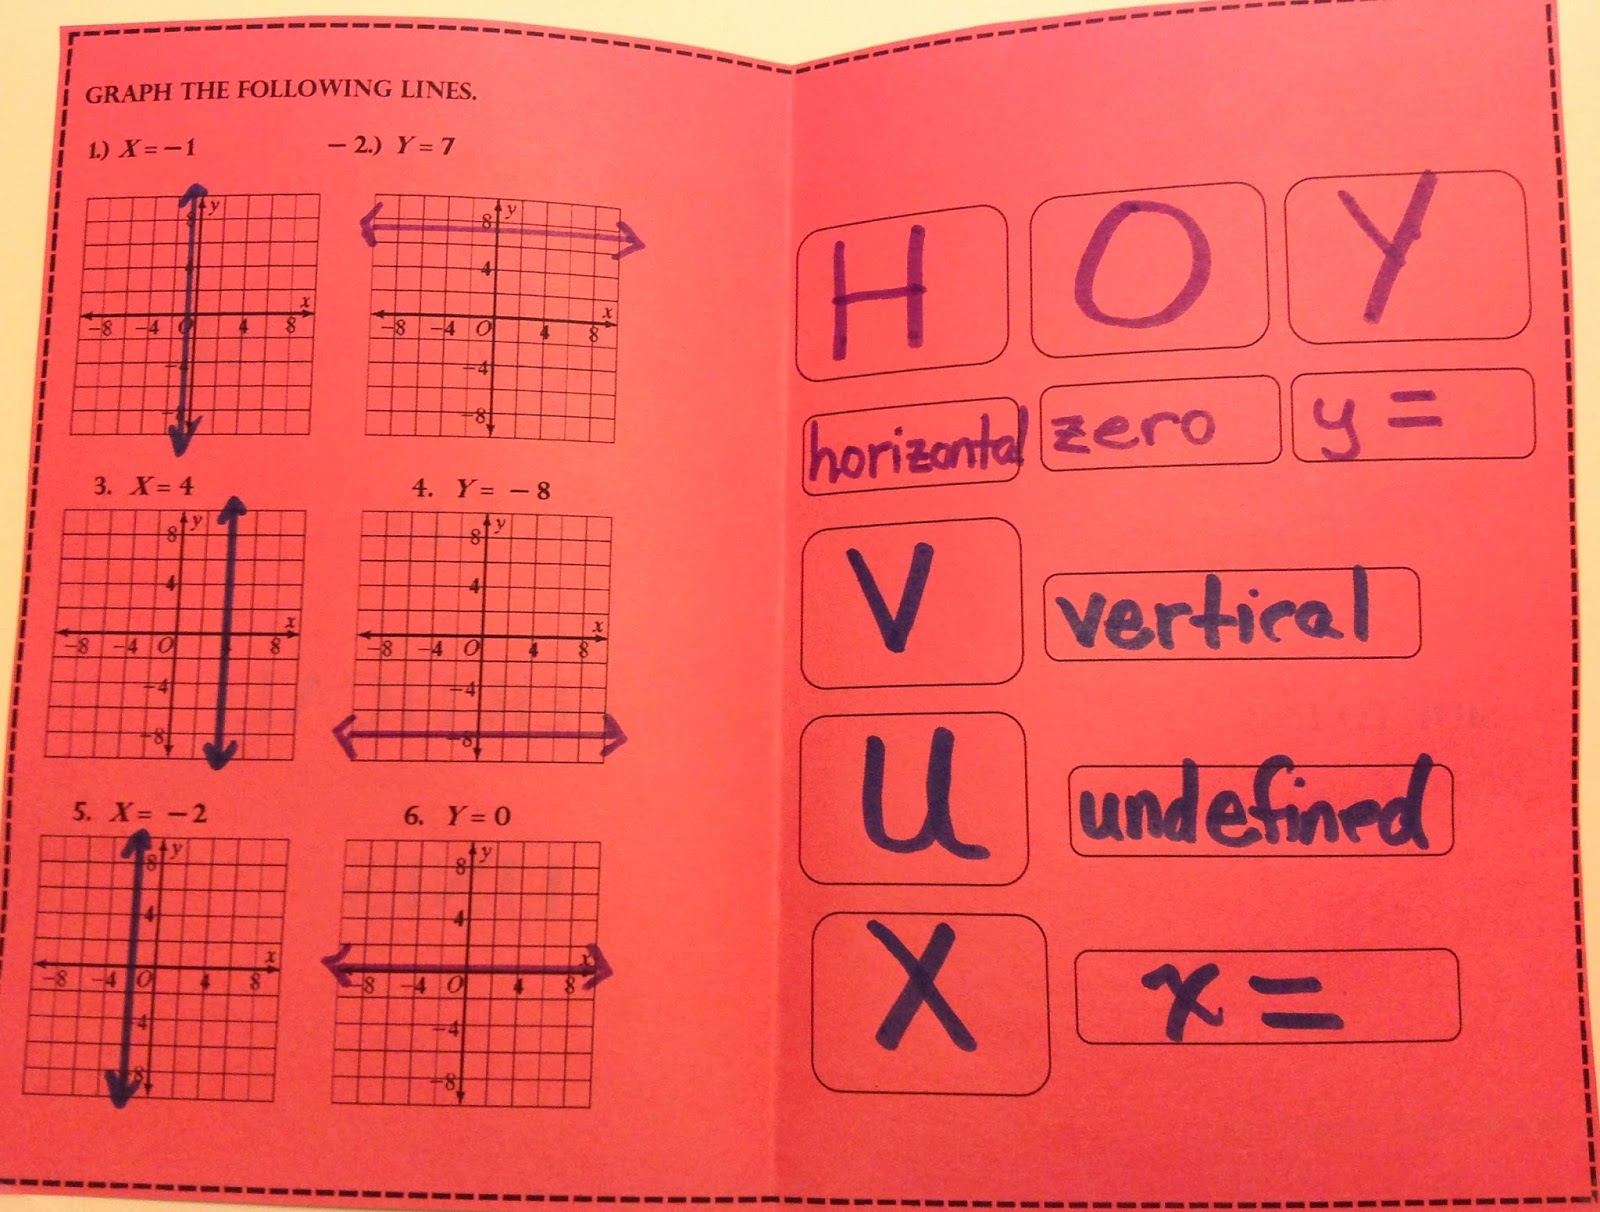
Then they did the INB page below with their partners. 
I probably should have added a vertical line on this page as well.


Followed by this activity from illuminations.
              2570-Pic-Triangle12570 triangles 22570 triangles3
     There were a few other activities that I will share in a later post.

     Of course we watched Colin Dodds Slope video. 
The kids love his songs and so do I!


     It was worth spending this amount of time on slope triangles. It gave the students an added visual for finding slope that I know many of them need. I was happy with how much the slope triangles helped my struggling students. When they would hear the words slope triangle they knew exactly what they needed to do. 
     
Click here for a copy of the documents:

Tuesday, June 09, 2015

HOY and VUX foldable - updated

I'm cleaning out the drafts that I started so disregard the statement that I am still in school. You will see lots of posts like this in the next few days. 

So much to do and so little time. It is nearing the end of the school year and I'm crazed!!!! This picture sums up how I feel right now. Our middle daughter is a first year high school science teacher and she asked me, " Mom is the end of the year always like this? I am so stressed and can't get everything done." I answered, "Yes sweetheart it is. Then June will come, you will sleep for one month and wake up in July and feel normal again."

(This has been on Facebook and I'm sure you've seen it. 
I searched for the originator of this picture with no success.
I have no idea who created this so I can't give credit. ) 

So to save my sanity, I am going to post lots of odds and ends over the next few days. I literally have 50 drafts of bits and pieces of posts waiting to be finished. It's time to clean out that draft folder and start sharing. So here is the first one. 

One of my first posts on this blog was my HOY and VUX graphic organizer. See original post HEREThis is an updated version made into a foldable. I think I like this one more.


      Click here to download the HOY and VUX Foldable.

I still have the HOY written horizontally and the VUX written vertically which is one aspect of the original that I really thought was helpful for the kids.


Hope you enjoy the updated version.
Til next time,
Jan


Wednesday, June 03, 2015

Too good to throw away - Circle Graph Project

     YES! Today was our last day of school and I am so exhausted. Not because of the craziness of the year but because the building is being painted this summer and we had to pack up our rooms. I usually leave posters on the walls, books in bookcases, have bulletin boards up before I leave, but not this year. I literally have 5-four drawer file cabinets filled to the brim with projects, worksheets, tests and quizzes. I had to place a couple drawers of each in boxes so the file cabinets wouldn't be so heavy. I also have one closet and two big cabinets filled with stuff. (A lot of this is math department supplies and I am the Lead Teacher who gets to store it all.) Thirty years of stuff. UGH! I envy my younger colleagues who have everything stored digitally. It's my goal to have everything saved digitally but having time to go through all of it, and sort, file, throw or scan everything is overwhelming. But I made a little progress today. I threw out 2 file drawers of materials on topics that are no longer part of the curriculum so it is a start.
     During my cleaning frenzy, I found a project a student completed five years ago that I use to do with the kids at the end of the year on circle graphs. I would count this project as a test grade, which now I would call a summative assessment. I love this project because it involves angle measures, percents, data collection, constructing circle graphs and of course coloring. I miss doing this unit. Sigh :(


Circle graph project

Directions:

You are going to create a circle graph that displays the activities that you do in a 24 hour period. Everyone’s data will be different and all the circle graphs will be unique to the person that completes it.

  • First, you will need to make a list of all the activities that you are involved in over a 24 hour period and place them on the chart.
  • Next, you will write down the times that you are involved in those activities. You will need to change the time to minutes.
  • Then you will find the percent of the day that activity takes.
  • Then you will change the percent to the degrees that it would represent in a circle graph.
  • After the chart is completed you will create your circle graph.
  • Use the compass to draw a circle that has a radius of 3 inches on the construction paper you have been given.
  • Cut out your circle.
  • Now draw your circle graph using the information on your chart using your protractor.
  • Your circle graph will need to be labeled with the activity and percentage on each sector of the graph.
  • You will need to color your circle graph as well.

You will be graded on neatness and how the circle graph is displayed. I will check all of the computations and degrees and grade you on the accuracy of your answers.

This will count as a test grade as this is a major project.


I got them started on some of the categories. Electronics and TV were separated so I could see the difference. I would probably group them together now as many kids watch TV on their IPADS or phones. Look at the homework section. I would say many of my kids don't spend that much time on homework. Sad. 


Click here to download circle graph chart and directions.
 I've learned not to post answers that can be copied.

 I don't have a rubric but this is a copy of the grade sheet I gave each student. It would not be on a percentage basis if I were doing this today. We grade on a 4-point scale now.


I can't believe I had this in my files.  Now I'm going to look for an awesome Weather Project I use to do about 15 years ago. We used newspapers, imagine that. LOL. 

Til next time,

Jan

Related Posts Plugin for WordPress, Blogger...